Hip-Hop Time Travelers
Me
Overview & Inspo
During class at the Lede Program, I would jot down notes for all the data stories and vizualizations that made me feel inspired. There were two data vizuals that inspired this project.
For a while I had an idea to create a blog about my obsession with 90's hip-hop. Me being me, I didn't just want to write a simple substack or tumblr, I wanted it to be different and cool, just like the music.
Back then I didn't know how to code or scrape or even how to put thoughts on a page so it remained an idea, like a yellow sticky note posted on a board titled, "some day".
But now, with my acquired technical skills and my acquired musical taste, I can finally turn my idea into reality.
Hip-Hop Time Travelers is a blog about falling down a rabbit hole full of funky beats and rhymes. It's attempting to capture the magical moments of listening to album for the first time and having the feelings of awe and needing more.
There are three data visualizations that all start at the album-level. Each will then dive deeper, song by song, into who worked on the track, play counts on Spotify, samples, influence, and audio features like beats per minute, energy, and more.
My goal is to create a new post every month about whatever hip-hop album currently has attention.
Techs
spotify

python

jupyter notebook

astro

d3.js

claude

Check It Out
Scope
Data Viz 1
This interactive data viz was inspired from the New York Times. Theirs, broke-down Obama's budget into categories like mandatory spending and discretionary spending, sorted it by department, and charted the changes (cuts and increases) to categories like education and energy.
Mine was breaking down something just as impactful -- a hip-hop album. Jokes and content aside, the mechanics were the same. For the viz, data was gathering using Spotify's web API and scraped from whosampled.com and also, Spotify again (more on that in Complexities).
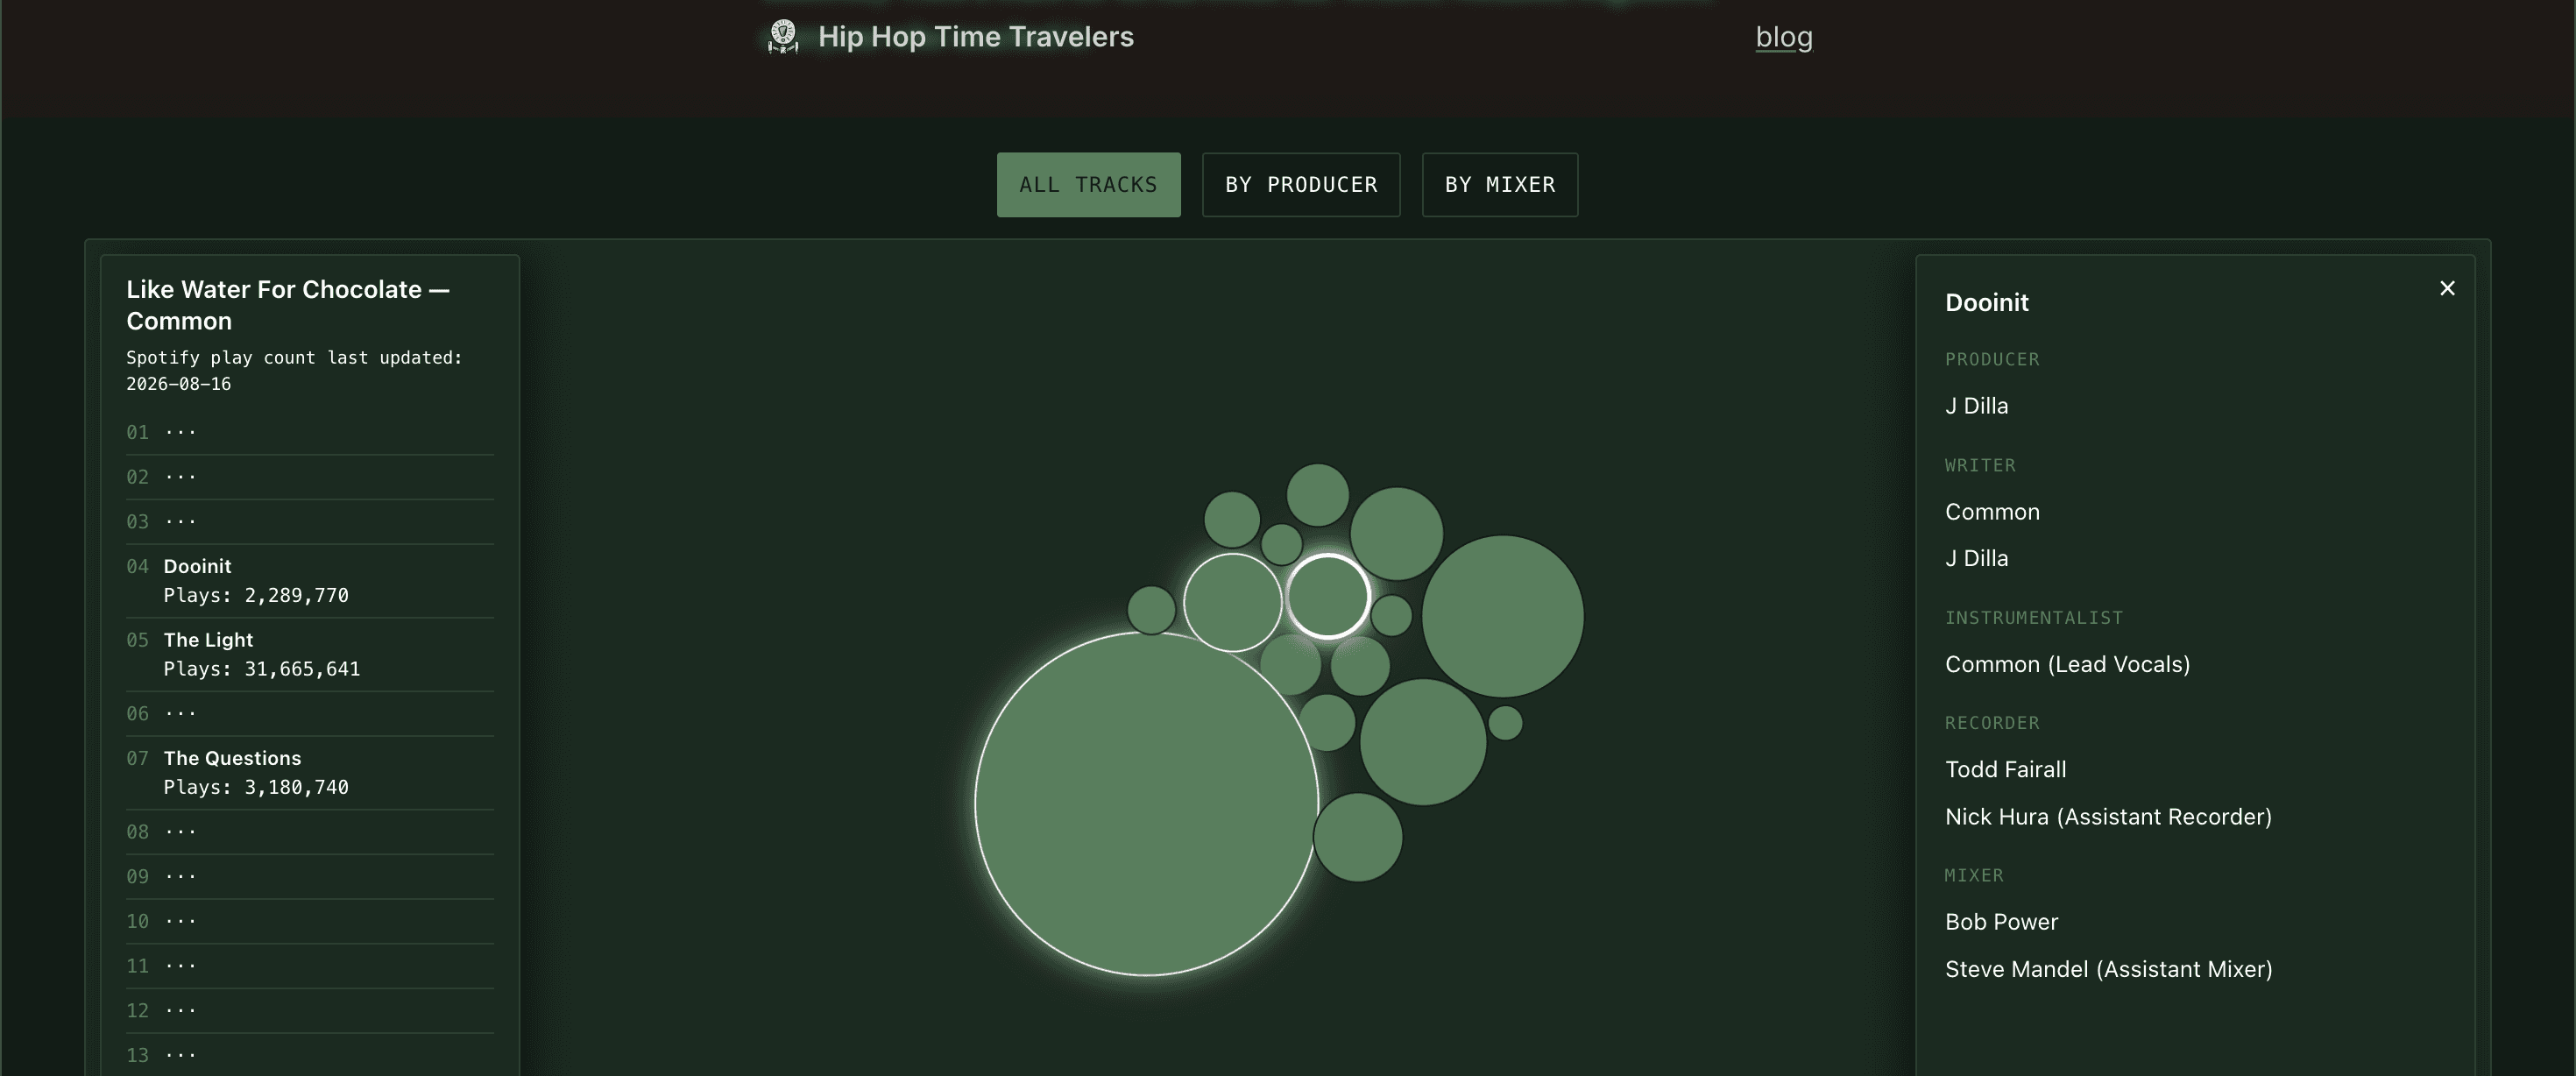
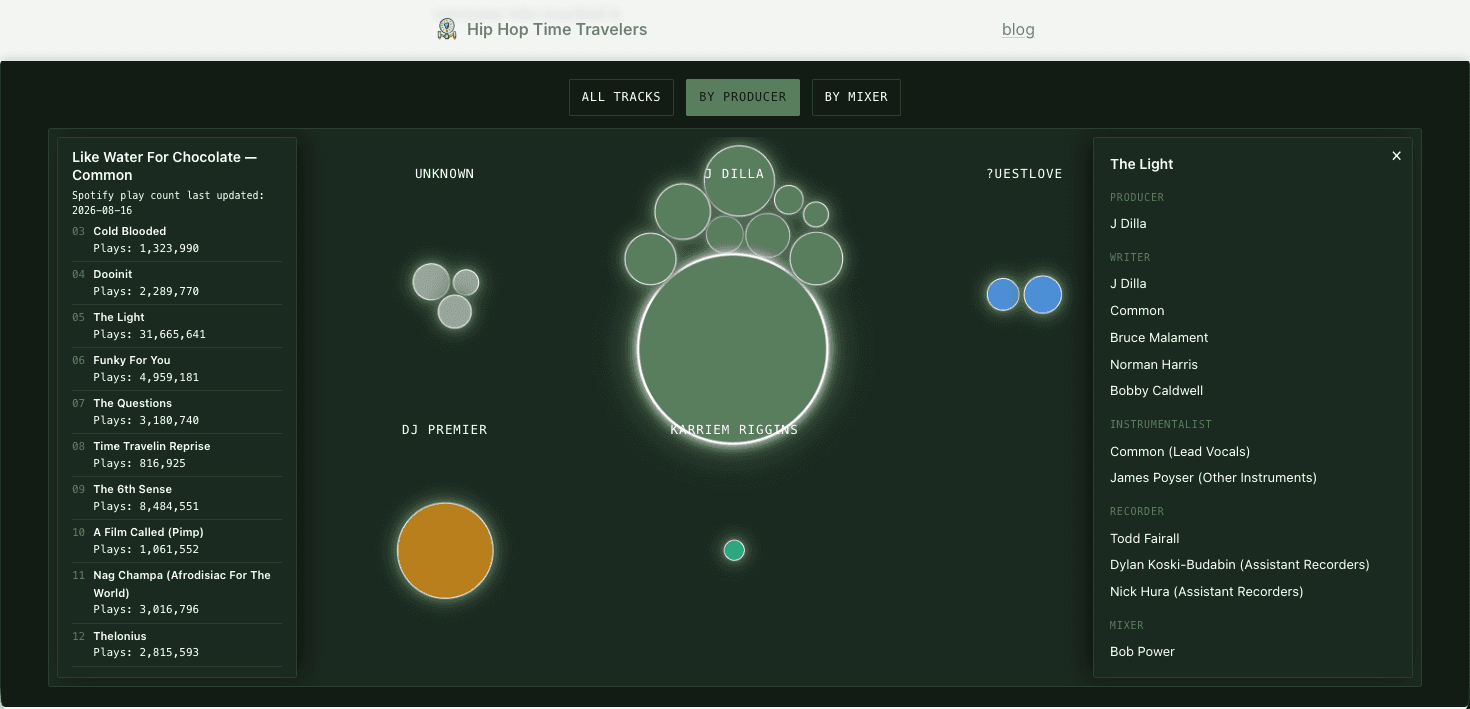
Each circle represents a track on the album and are sized according to the number of listens on Spotify. Clicking on the circle will open a panel displaying song credits i.e. who worked on the track and what their role was.
There are buttons at the top of the viz that will sort and animate the circles into categories. For this, I chose by producers and by mixers because I was personally curious to see how it would unfold.
Then, I started to have some more fun with it. I added a "vibration" effect to the circle to mimic the beat of a song. I thought the pulsation was attention-grabbing as well.
Finally, to gamify things, hovering over each track's circle will reveal it on the left-side panel, which is an empty tracklist until songs start to get added.
Data Viz 2
This one was inspired from both the New York Times Obama Budget and The Pudding's Music DNA.
I liked the way NYT charted the changes for the budget. It's a linear display that shows a spread on a scale with relative size for each node.
Talk to any hip-hop head about any album and you'll notice that they LOVE talking about the beats and the samples.
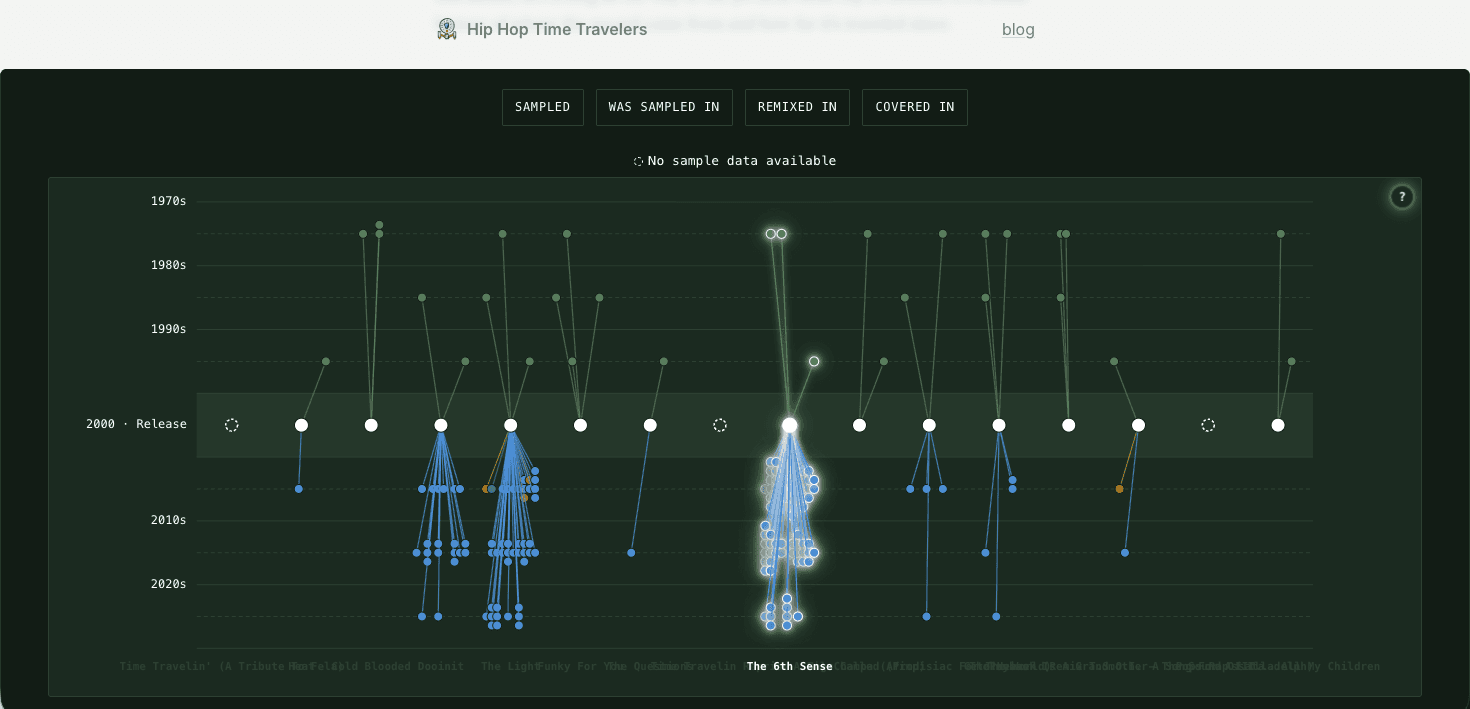
So, my idea was to combine those two concepts into one. The result was a timeline with the central focus being the year the album was released. Each track would then chart it's samples, reaching back into time, and showing the viewer how many songs were sampled and how far back each sampled song went.
But then whosampled.com had even more interesting data to use. They collected songs that were later on influenced by the track in focus. Meaning, we could see what songs then went on to sample the songs on the album. This gave me the network sensation that I was aiming for. Our album's songs would be the central hub and node of demarcation between the past and the future. What songs did this track sample? And then, what songs did this track go on to influence?
Data Viz 3
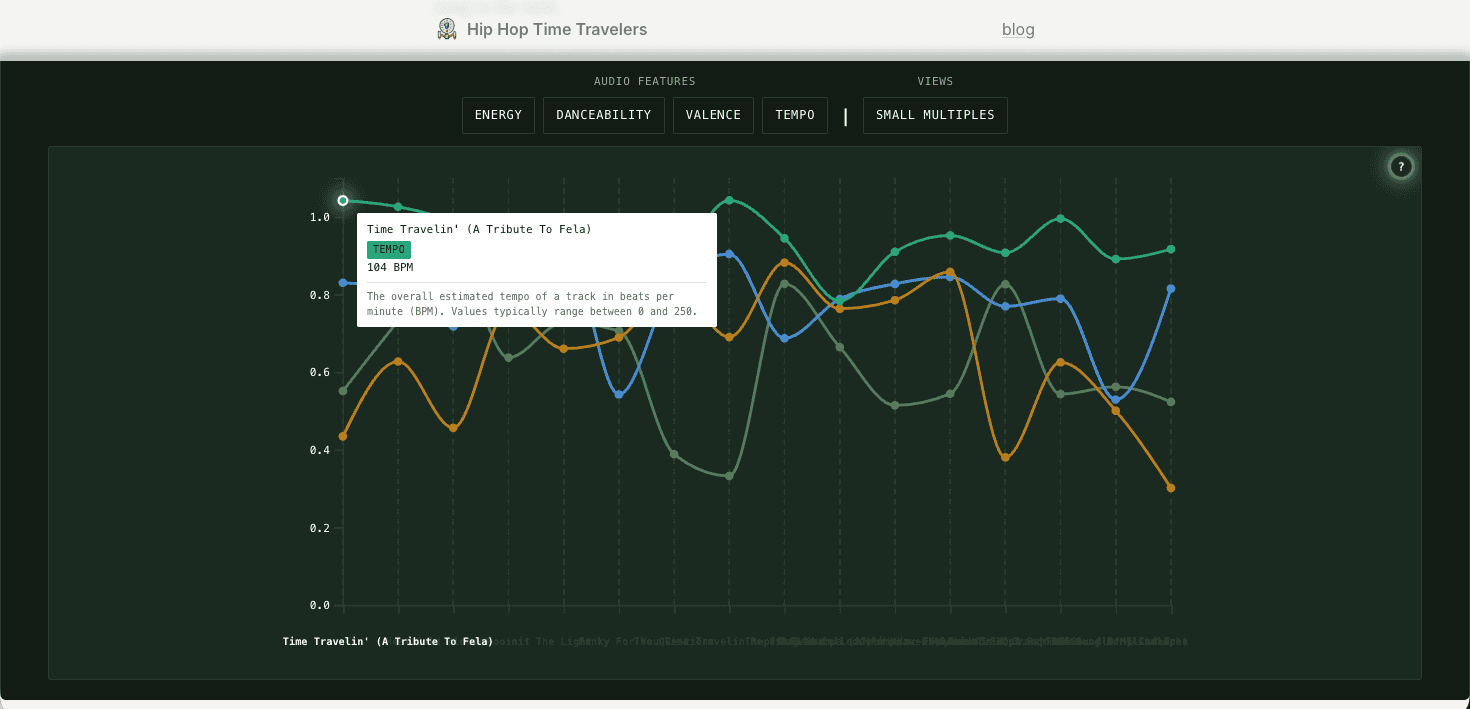
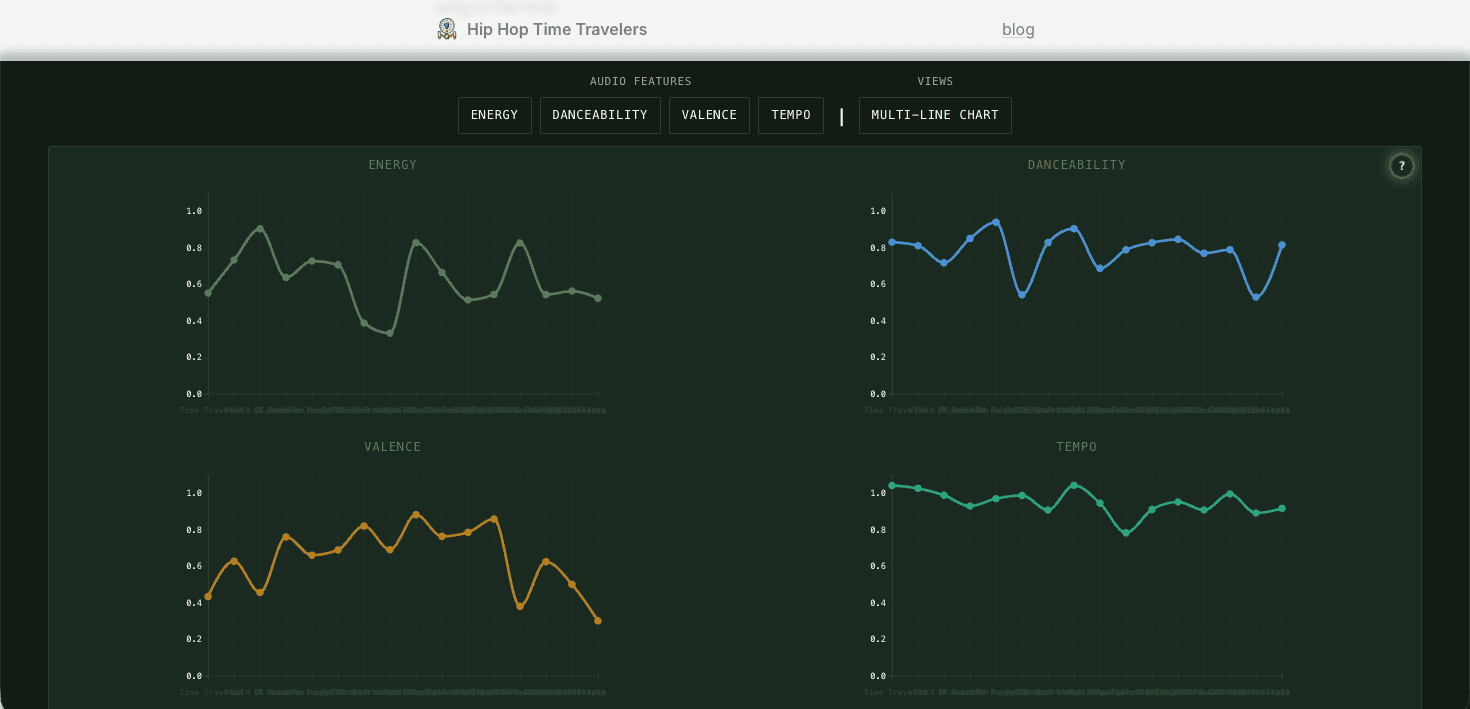
This viz uses data from Spotify's Web API. There were only a couple simple calls to make; got it into a CSV and then D3 did the rest. I could have used DataWrapper for this because there wasn't a large amount of customization but in the name of consistency, javascript won.
I was most interested in the Tempo metric, also known as beats per minute. I tried making a couple hip-hop beats once and they were horrible. But hey, you gotta start somewhere and all music producers and beat makers will say their first beats were trash too. (You should see the first website I coded. It's terrible lol. And it's actually linked on the Play page.)